Kentico And Azure Integration Possibilities — Part 3 — Application Insights
The joy of logging
Seeing detailed traces, logs and beautiful dashboards is one of the few things that immediately fire up my inner problem solving spark. However arriving at that point and stumbling upon an issue that only affects 2% of your users would be largely impossible without just enough logging to at least know if it is happening.
Thankfully, there’s application insights which, basically, out of the box allows you to dig through massive piles of logs with such ease that its price is comical when compared to the value it gives you.
Setting things up
Getting the bulk of available telemetry and logs from your app to Application Insights is pretty simple.
From visual studio open up your Kentico application (MVC or Web Forms) and navigate to Project -> Add Application Insights Telemetry…
You will be presented with the following screen -
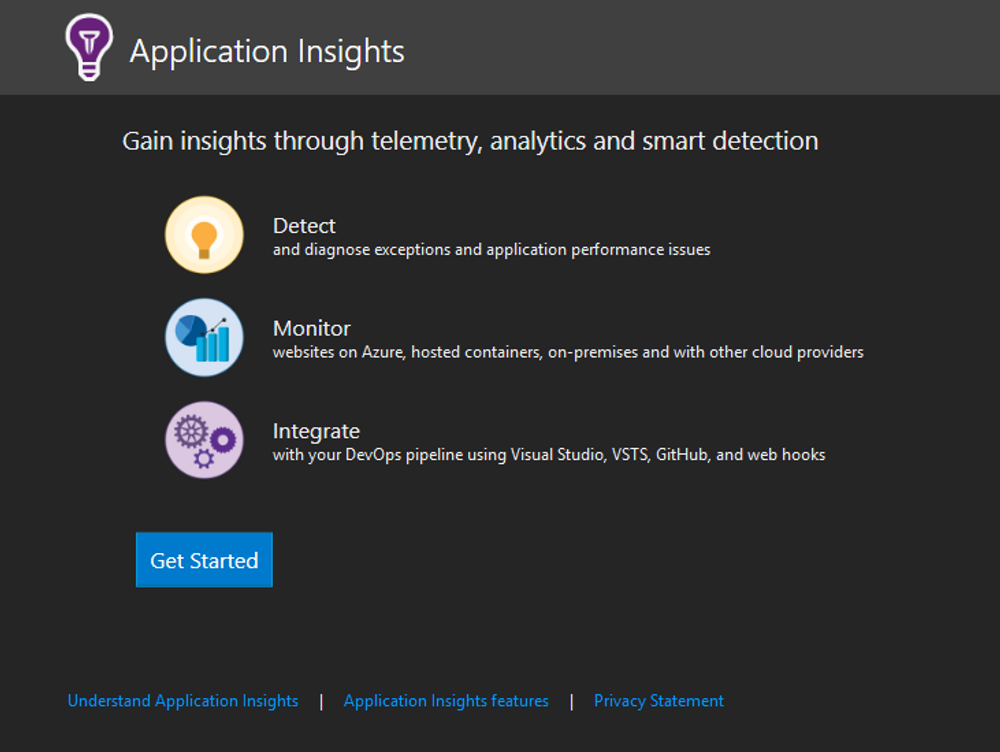
From this point on, click on “Get Started”, select your Azure subscription and you are already good to go!
Logs will start shipping from your local instance immediately after starting it up.
To add some additional logging right off the bat, when presented with this screen:
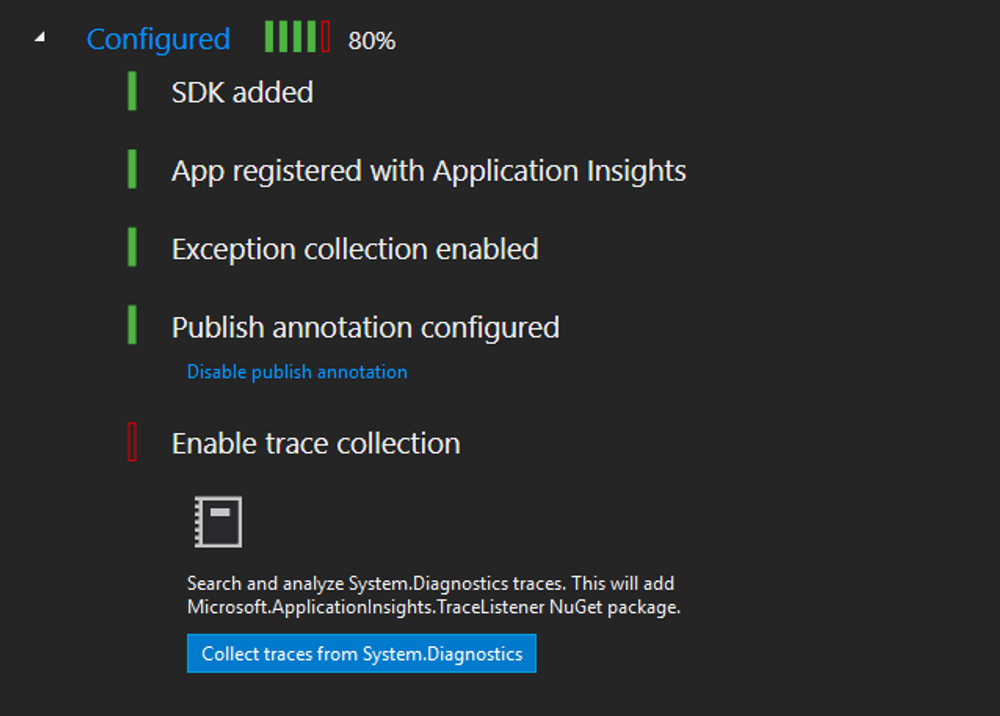
Click on “Collect traces from System.Diagnostics”. This installs a TraceListener NuGet package which will allow you to ship Trace logs directly to Application insights by using the following methods:
When you now start up your application, you can take a look at the Application Insights data in two ways.
One is to navigate to View -> Other Windows -> Application Insights Search and checking out data from your current debugging session directly from visual studio.
Another way is to navigate to the Azure Portal and checking out the logs and telemetry from there.
Immediate benefits
As soon as you’ve done a few of these simple steps and deployed your application to production, useful logs start shipping in to Application Insights. We’ll go over a few of the out of the box features I found most useful during debugging sessions.
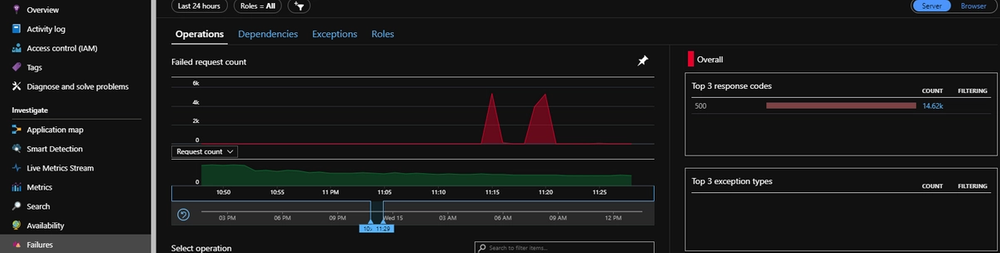
The “Failures” tab
Having this tab in real life might be a pretty unnecessary reminder of all of your past mistakes, but having it for a web application is quite necessary and helpful.
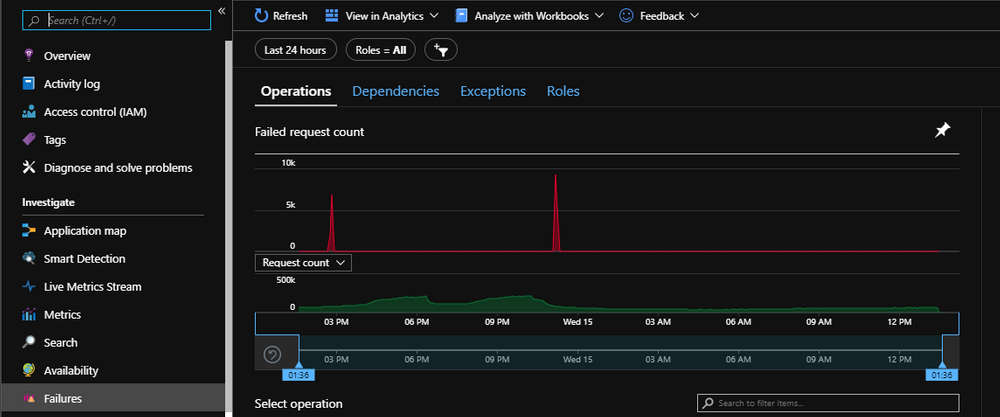
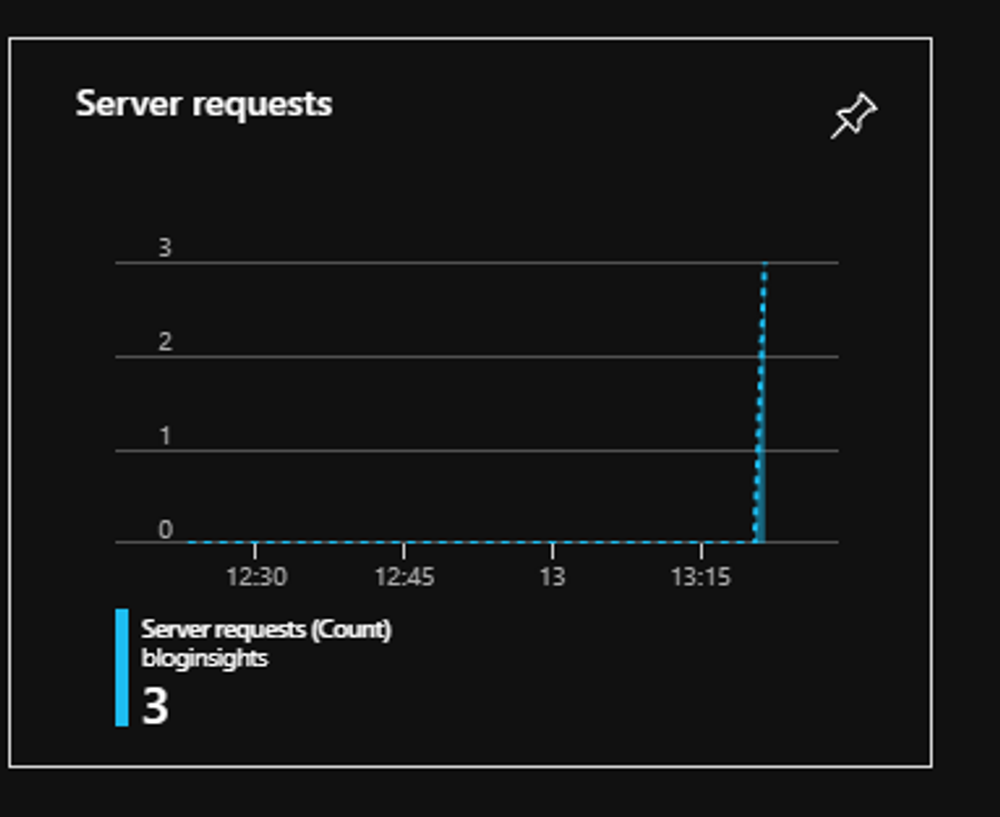
This is an example for a real-life application currently in production and it is very clear from this graph how many request were arriving into the application at certain times and there’s also 2 instances of an obvious downtime (It happens to everybody).
You can also see a timeline with two draggable ends below the graph. This allows us to drill down into certain points in time.
Live metrics stream
Sometimes looking at historical data is not what you want to be doing if your application is currently under-performing or having an unusual amount of exceptions.
Application Insights can connect to your application directly and show you near-live data of the telemetry from it.
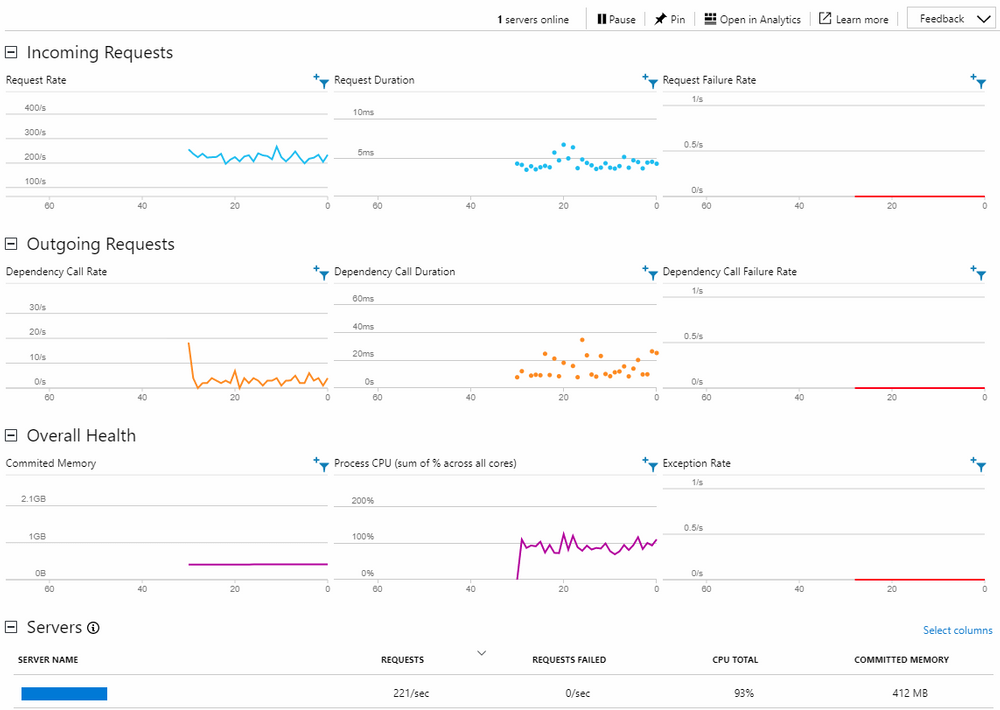
This is particularly useful when there is an unexpected increase in requests to your application. When this happens you can quickly check out the requests per second on the live metrics and see if the CPU, Memory, or an external dependency is a bottleneck.
Above and beyond
This is just scratching the surface of what you can see in Application Insights without even needing to write a single line of logging code.
You can analyze the performance of the application on the “Performance” tab, do elaborate analyses with the “Workbooks” feature, check out the connections your application has with other parts of your infrastructure in the “Application map”, take a deep look at your logs in the “Servers” tab and many other great things.
Integrating with Kentico
Even without doing any additional work, the logs and metrics you receive are very detailed and useful, however there’s a few extra things you can do to make logging from Kentico more useful.
Kentico excessively uses the Kentico Event Log internally and developers tend to use the event log for some custom logging as well. Sadly this is not a maintainable solution since the event log is a very simple (too simple) logging solution.
We can improve it by creating a solution that doesn’t require us to change any existing code and redirect the event logs straight into Application Insights.
The following example is an implementation on Kentico MVC:
Simply add this class anywhere in your solution (App_Start might be a good place) and call the method from your Global.asax file.
This is a very basic example of how to redirect event log calls from your MVC app into Application insights and can easily be expanded and improved. Here’s a great article that gives a good overview of more of the logging possibilities in Application Insights.
Wrapping up
Having the right metrics and logs available for you application is a huge topic and cannot be covered in such a short article, however I hope I’ve given a nice overview of the possibilities you have with Application Insights and demonstrated its value.
See you next time when I will cover Azure Service Bus.